Marion Romberg
Objectives of the Project
During the late Renaissance, around 1570, humanists developed a new “shorthand” way for representing the world at a single glance: personifications of the four continents (Europe, Asia, Africa, and America). While the continent allegory as an iconic type had already been in use since antiquity, humanists and their artists adapted the concept by creating the four-continent scheme and standardizing its attributes, based on models such as Cesare Ripa’s Iconologia from 1603.[1] Europe is commonly depicted as first among her sisters, sitting frontally between two cornucopias, from which a variety of plants swell (Fig. 1a). She is dressed in flowing coloured robes with a golden crown and surrounded by numerous objects that emphasize her erudition (books, owl), piety (tiara), claim to power (crown, banner) and sense of art (hammer, chisel, brush, a palette of paints, music book and quill). A horse or a bull, referring to the myth of Europe, generally accompanies her. Asia is dressed in a white undergarment and a red cloak, waving a smoking censer and holding a bouquet of flowers and spices, which also adorn her hair (Fig. 1b). Below, she has accumulated firewood. Her usual companion, a camel, is missing here. Africa, the dark-skinned allegory, carries an elephant’s head and trunk as headgear (Fig. 1c). Around her neck hangs a coral-coloured pearl necklace, which corresponds with the yellow of her top and the pink of her cloak. She holds up a scorpion and a cornucopia full of ears of corn. A lion and two snakes rest on the ground. America wears a white and pink striped short robe that leaves her legs uncovered (Fig. 1d). She is the only one with her upper body bared. Her head is adorned with a feathered diadem and a quiver full of arrows lies behind her. Her right arm rests on a yellow cloak, which she uses as a seat cover. She draws bow and arrow, raised in the air as a sign of victory. At her feet lies a human head pierced with an arrow. A reptile completes the image, which is meant to convey a sense of savagery.
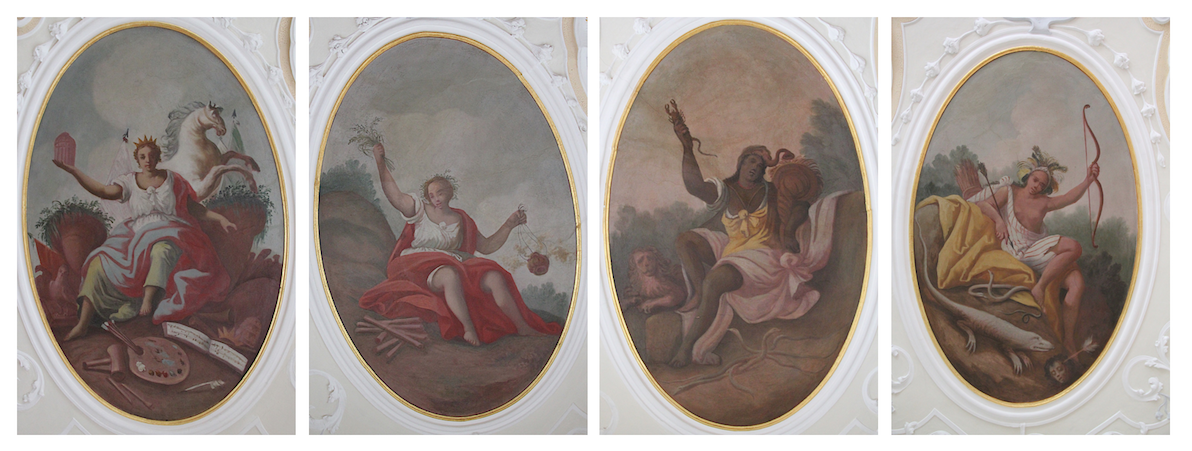
Figs 1a-1d (Left to Right). Johann Gabriel Roth, Europe (1a); Asia (1b); Africa (1c); America (1d), ceiling, Neues Schloss, Kißlegg, 1721. Fresco. Photo: Marion Romberg, 2011. Erdteilallegorien.
During the next 230 years, this iconic scheme proliferated widely. All known media were employed to bring the four continent allegories into the public and into people’s homes. Within this prolonged history of personifications of the continents, the peak was reached during the late Baroque period and especially the eighteenth century. As a pictorial language they were interwoven with texts, dogmas, narratives, and stereotypes. Even so, the question of what the continent allegories actually meant to people living in the Baroque age requires further consideration.
Notably, though not exclusively, this question was the topic of a research project on continent allegories carried out at the University of Vienna’s Department of History between 2012 and 2016 and financed by the Austrian Science Fund. The project team, made up of historians and art historians, approached the subject in a new and systematic fashion. Firstly, we selected a clearly defined geographic area with a large concentration of Baroque sites consisting of the greater part of the Southern Holy Roman Empire, from Freiburg in the Breisgau to the eastern frontier of Lower Austria including Vienna. This region was fairly bounded, with the northern limit of the study area constituted by the Main River and the southern one by South Tyrol. Secondly, we chose to focus on continent allegories in immovable media, installed as fresco, stucco, paintings and sculptures within abbeys, palaces, parks, gardens, townhouses and, most importantly, churches.[2] For the purposes of this research corpus, portable artifacts like faience, book illustrations, maps, atlases, prints, or terracotta figurines were not included. Few artifacts of this type have remained in their original location or in the contexts for which they were intended, and their provenance is therefore often difficult or impossible to reconstruct. This is quite different for allegories of the four continents in immovable media, for which we can reconstruct the social and cultural contexts in which they originated as well as the spatial and functional conditions governing how they were conceived, looked at, interpreted, and understood. Thirdly, our investigated time frame extended from the late sixteenth to the mid-nineteenth century, with the mid-eighteenth century forming the key period (Fig. 2).
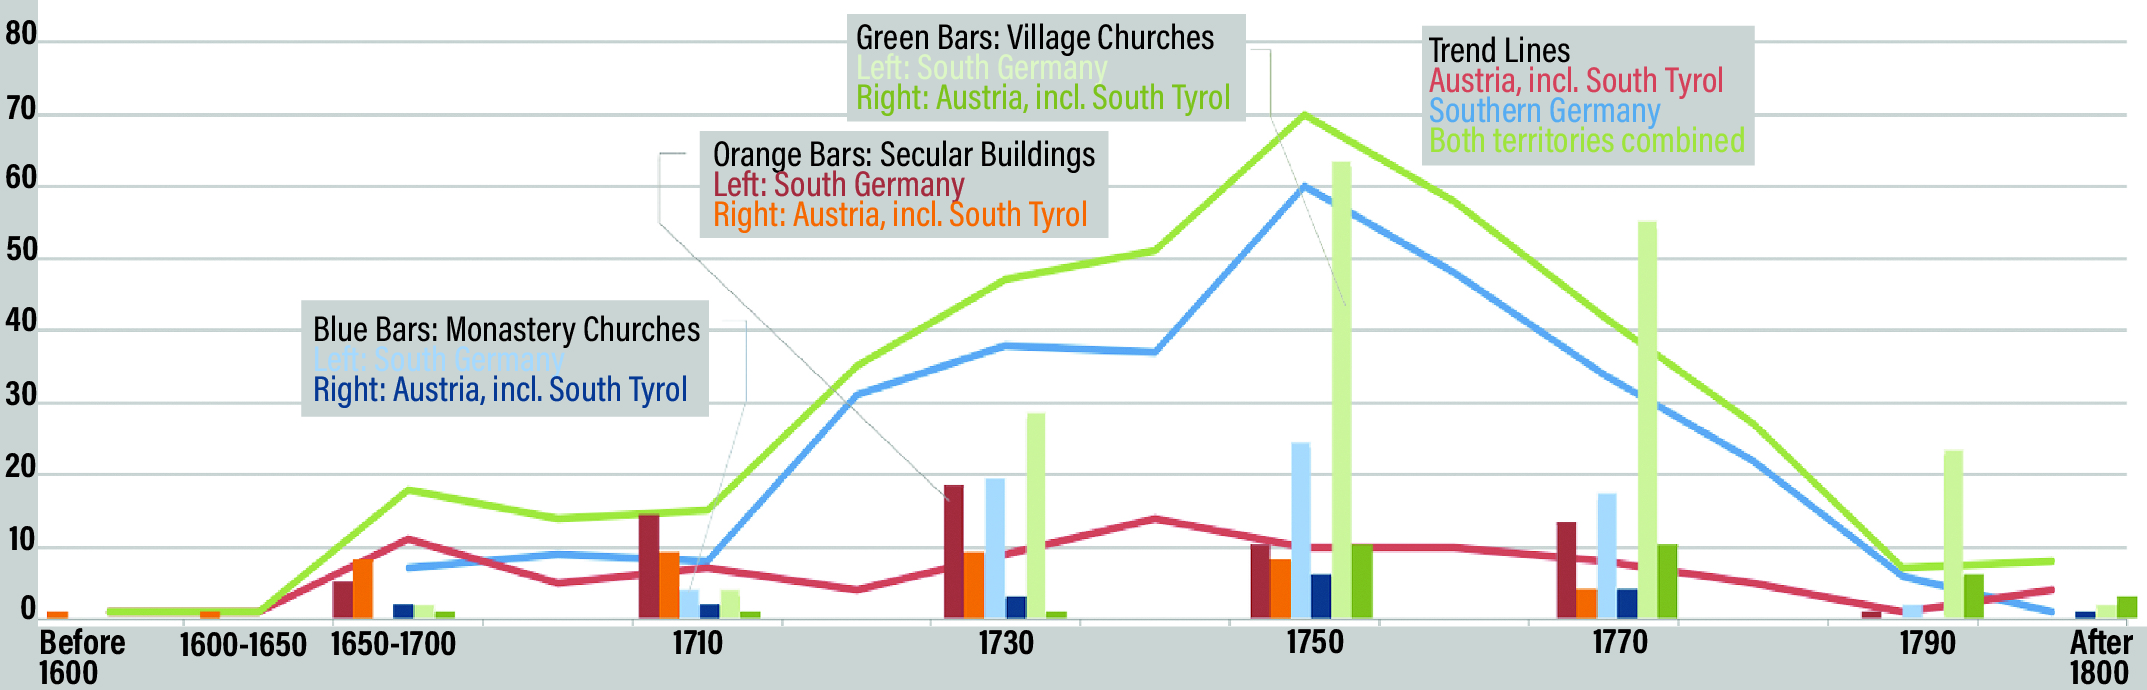
Fig. 2. Graph representing the number of instances in which the four continents iconography appears, based on building type and sub-region within the Baroque high-density area, over the eighteenth century. Graph created by Marion Romberg using Excel, 2017, and modified by Nancy Um using Adobe Illustrator, 2018.
The survey conducted by the project team identified over 400 instances of continent allegories in the southern part of the Holy Roman Empire. To facilitate the systematic and detailed analysis of all identified instances of continent allegories, a database was developed and is now available to the public: http://continentallegories.univie.ac.at.
The project team followed a number of steps and protocols in the process of gathering data. Firstly, members of the project team personally visited all instances of continent allegories identified in a preliminary survey. Both the respective depictions of the four continents and the entire iconographic and architectural context they are situated in were thoroughly documented through digital photography and descriptions. Secondly, the database structure and guidelines for record management were developed using the ICONCLASS system, as discussed below. Data are physically stored on a server belonging to the University of Vienna, guaranteeing long-term accessibility and permanence of links. The hypermedia environment specifically developed for this project by Julian Rödelius (Vienna) allows access to detailed descriptions of objects along with high-quality images and corresponding details. Each object record contains information about its chronology, restoration, primary sources pertaining to the images or architecture, and bibliographical information. All objects are navigable via subject indexing and hyperlinks.
Structure of the Database: Categories
The heart of the database is defined by three different categories of entries, which are used to define the corpus and group the various categories of data:
- “Erdteilallegorien” (Continent allegories) contains all digital images, basic information, descriptions and analyses.
- “Orte” (Sites) contains basic information on the buildings and places where continent allegories are found. This includes an outline of the respective building’s history, information on its historical and current political and administrative affiliation, and an outline of pilgrimage history where applicable.
- “Personen” (Persons) includes all artists and patrons involved in the production of the examined continent allegories.
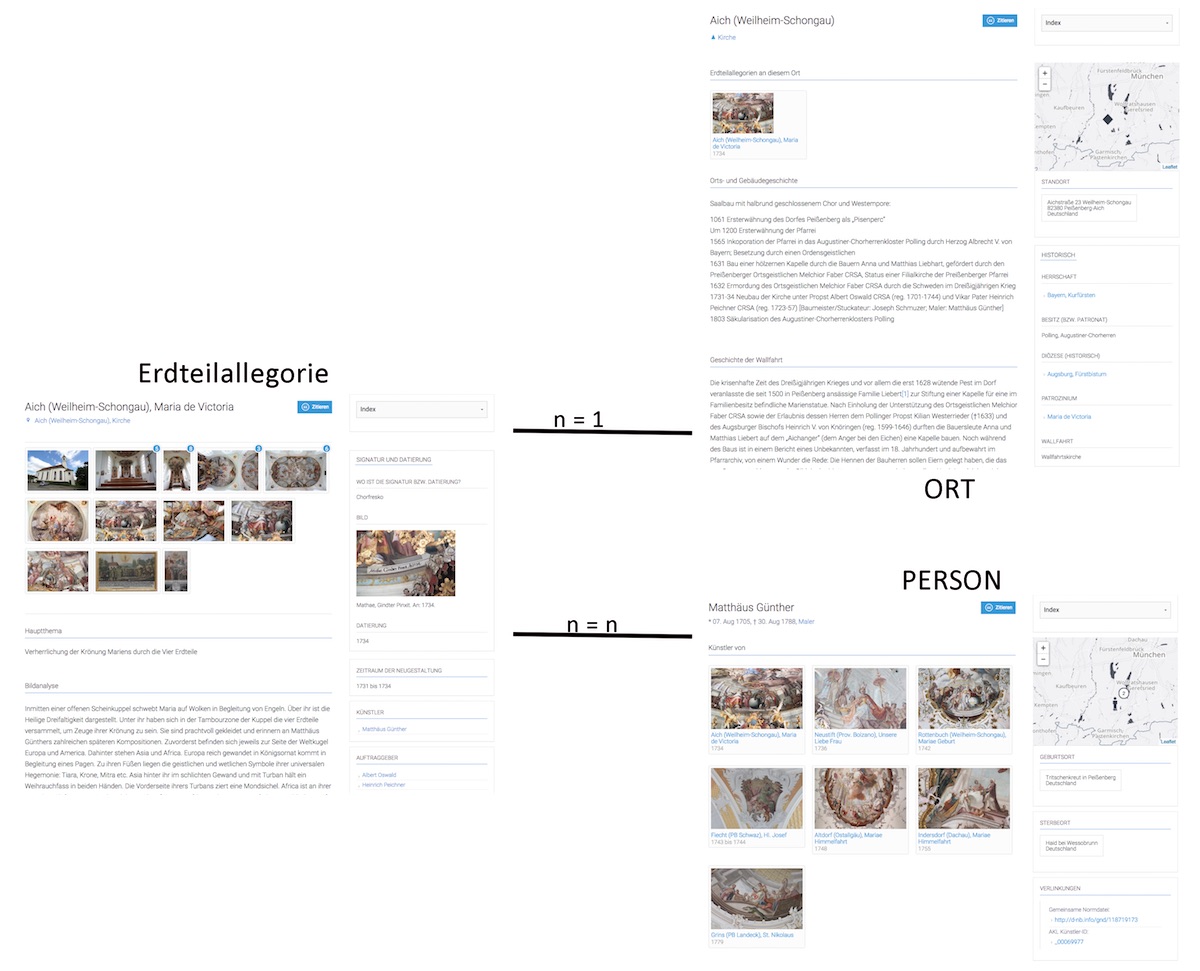
Fig. 3. The relations between the three categories Erdteilallegorien (Continent allegories), Orte (sites), and Personen (Persons). Image created by Marion Romberg, 2017, with screenshots from Erdteilallegorien.
The relationship between these three categories is as follows: While each continent allegory is always assigned to exactly one fixed site, several continent allegories can be located in different sites in the same location, generally in a monastery or a palace. The connection between people and continent allegories is based on a “n:n” ratio: For each continent allegory, several artists as well as different principals can be involved at different degrees of intensity or significance. As pictured in the visualization above (Fig. 3), the continent allegories in the pilgrimage church of Maria de Victoria are located in the village of Aich. They were painted by Matthäus Günther in 1734, who used this iconography at six other places during his career.
Exploring the Database: Graphical User Interfaces
Four major graphical user interfaces provide access to the database: Karte (Map), Zeitleiste (Timeline), Index (Index), and an advanced search interface (Suche).
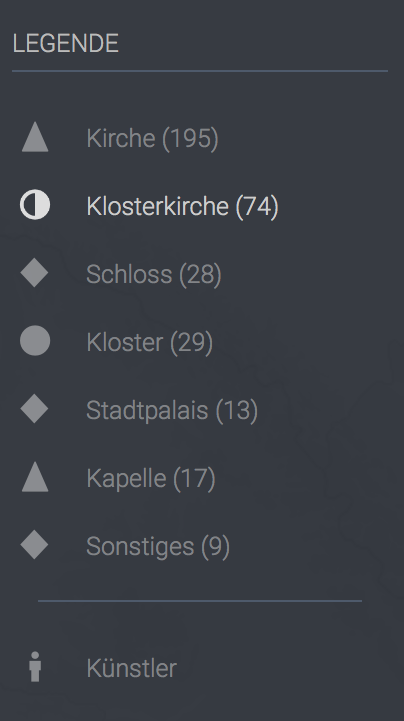
Fig. 4. Map legend with the option of selecting by building type or “Künstler” (artists). Screenshot taken by Marion Romberg, 2018. Erdteilallegorien.
A spatial representation in the form of an interactive map—KARTE—shows the political and administrative divisions of Europe from the sixteenth to the nineteenth century as well as in the present. The map, for which our programmer used Leaflet (an open-source JavaScript library for mobile-friendly interactive maps), can be navigated by means of the building icons on the map, a timeline and a search box for artists and places. The building icons on the map denote sites: castles, palaces, abbeys, abbey churches, churches, chapels, and other types of institutions. To limit the number of different symbols in order to improve visual clarity, more than one building type is subsumed under certain icons such as churches and chapels, palaces and town houses. By clicking on each icon in the box labeled “Legende” the user can display very easily the type of buildings he or she is interested in, such as “Klosterkirche” or monastery church (Fig. 4). The results can be defined further by adjusting the timeline, using the blue slider at the base of the browser window. It is also possible to focus only on the artists working in this area and during this time.
In order to determine the exact location of the site, we used the satellite view of Google maps to get the necessary GPS data and we added it manually to each entry in the category “Orte” (Figs 5 and 6). By doing so, an icon appeared on the interactive map, but also on a small map included in each entry that gives the user immediate information on the actual location of the site (Fig. 7). This step was necessary as the digital single-lens reflex camera we used did not add the GPS information automatically to the images (as is common with smartphones) and thus could not be extracted from the image’s metadata. Moreover, we needed only one exact GPS reading in order to pinpoint the site’s location on the map.
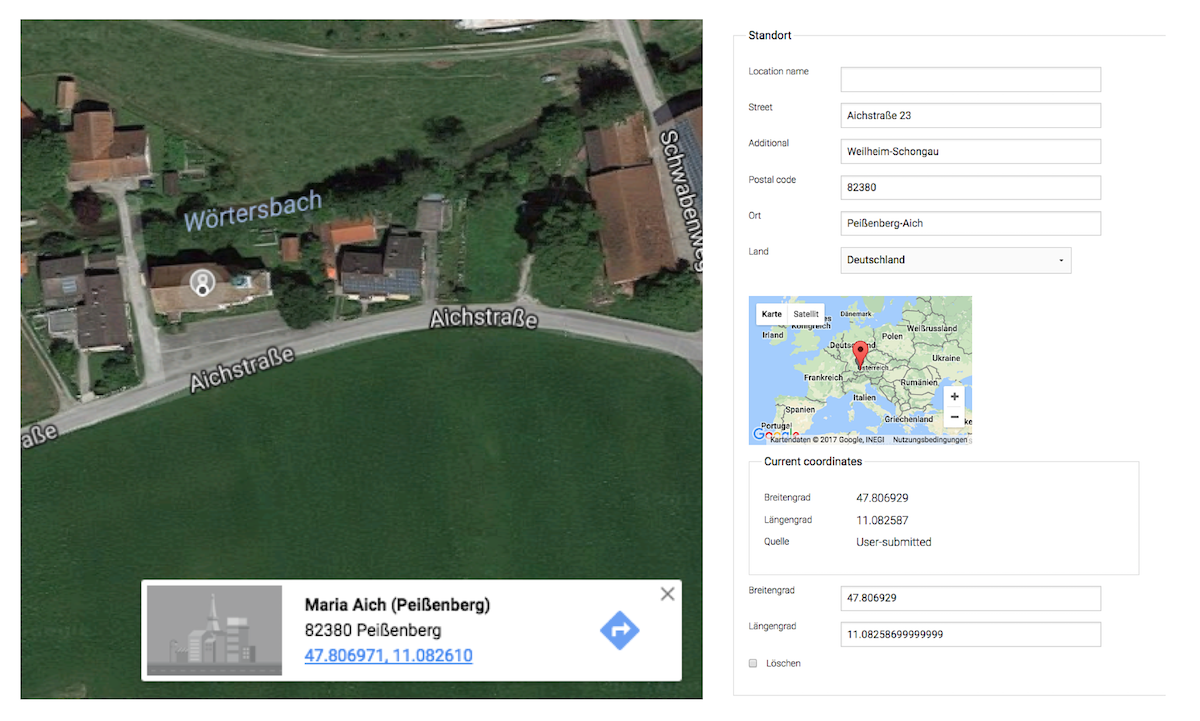
LEFT: Fig. 5. Bird-eye view of Church Maria de Victoria, Aich, in the satellite view of Google maps. Screenshot taken by Marion Romberg, 2017.
RIGHT: Fig. 6. Backend of the database Erteilallegorien. Screenshot taken by Marion Romberg, 2017.
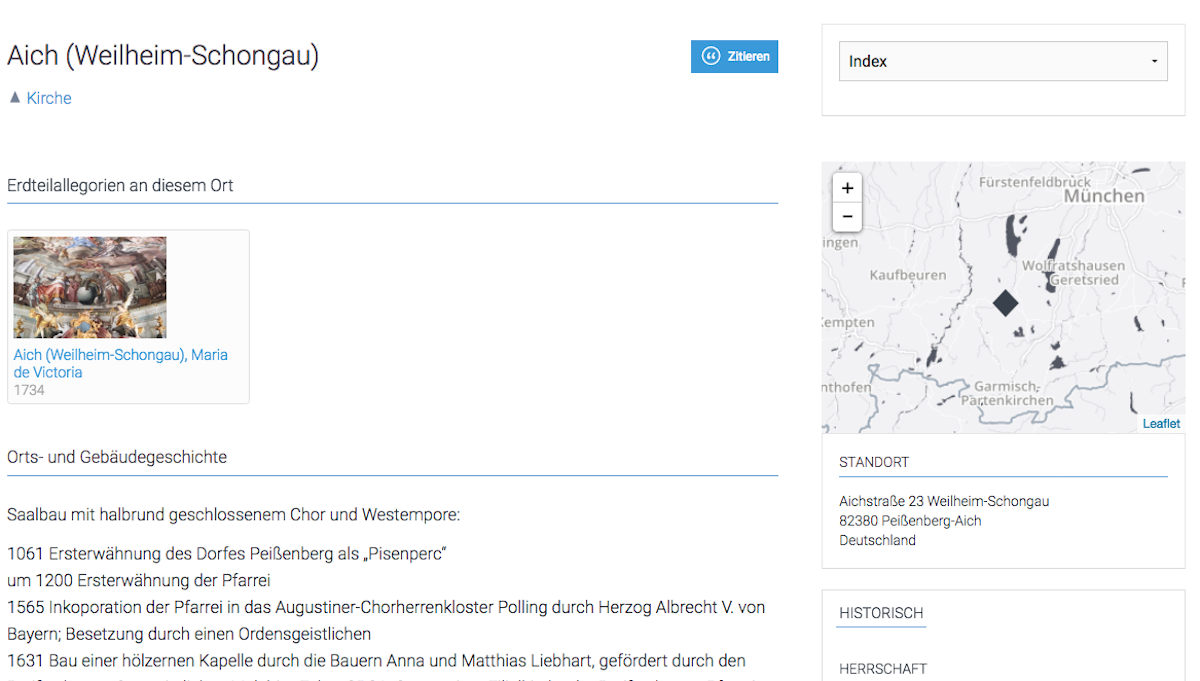
Fig. 7. Frontend of the database Erteilallegorien. Screenshot taken by Marion Romberg, 2017.
Finally, the historical dimensions of the map are derived from Euratlas, a commercial website, which provides standardized historical maps depicting the political situation at the end of each century. As our timeline ranges from the sixteenth until the nineteenth century and our research area focuses on the Holy Roman Empire, we bought four maps and implemented them. However, these maps show only the border of a territory at a given point in time, so it is not possible to zoom in; doing so results in the location of the site switching from the historical map to the current map. The Prince-Archbishopric of Salzburg, for example, was independent of Austria until the secularization at the beginning of the nineteenth century, as shown in a comparison of historical and contemporary geographies (Figs 8 and 9).
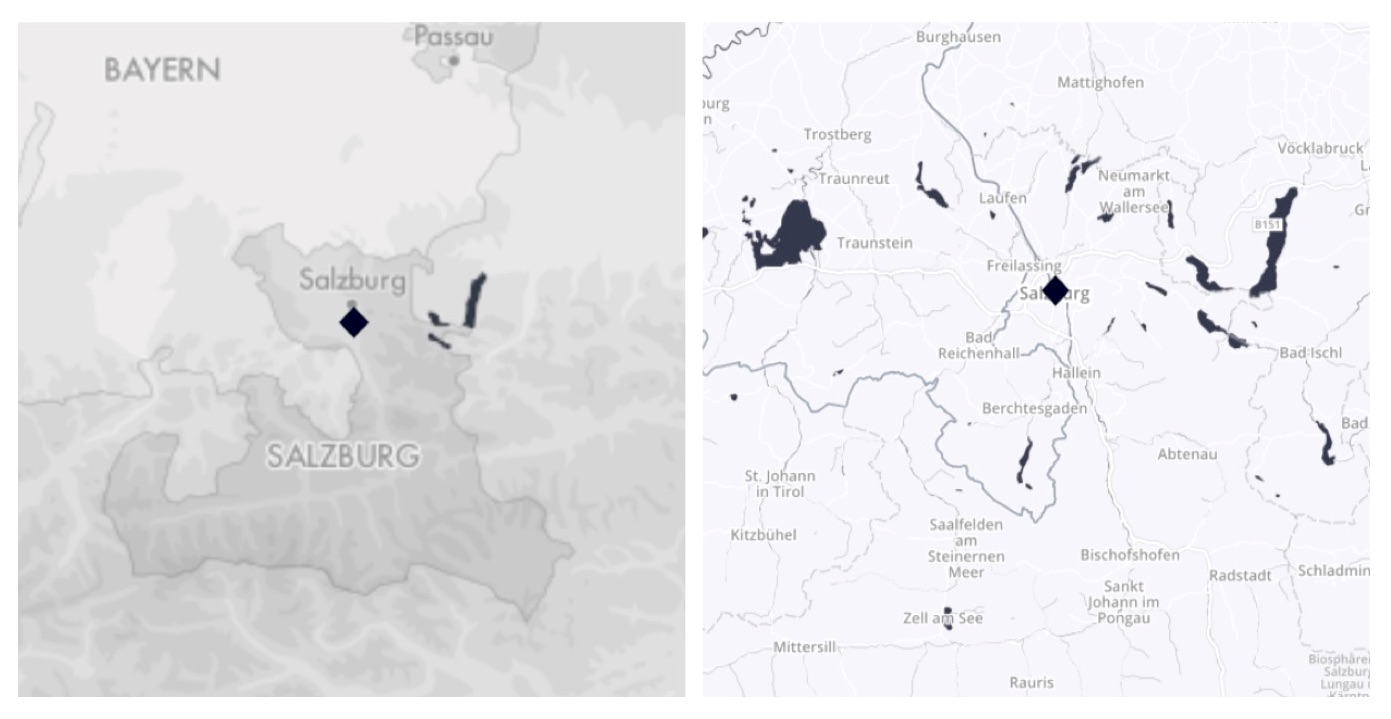
LEFT: Fig. 8. Historical territory of the Prince-Archbishopric of Salzburg. Screenshot taken by Marion Romberg, 2017. Erdteilallegorien.
RIGHT: Fig. 9. Current state of the Prince-Archbishopric of Salzburg. Screenshot taken by Marion Romberg, 2017. Erdteilallegorien.
A separate interface is provided through the interactive timeline—ZEITLEISTE—allowing for easy chronological navigation of the records. Here the entries are ordered according to the original period of creation. A search field also ensures easy and quick access (Fig. 10).
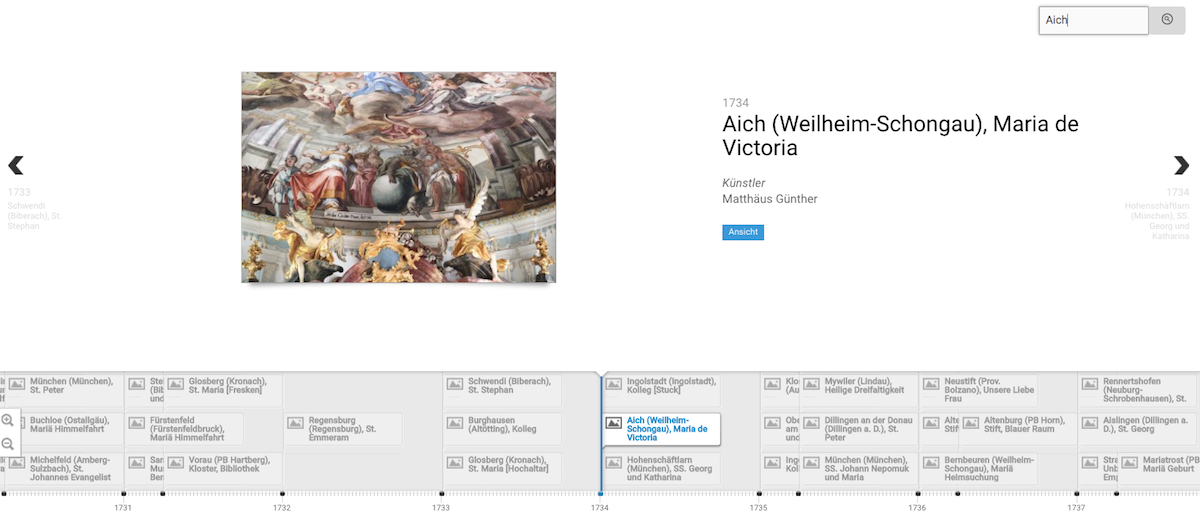
Fig. 10. Aich, viewed through the timeline interface of the database. Screenshot taken by Marion Romberg, 2017. Erdteilallegorien.
The index interface—INDEX—offers various indices listing continent allegories, persons, places, and taxonomies. While the allegories can be displayed either via grid (Fig. 11) or via list (Fig. 12), all the others are returned as an alphabetical list. The taxonomies are a list of all Iconclass codes assigned within the database. The iconographic classification system Iconclass is intended for art historians to describe and classify pictorial data, and is used by institutions throughout the world as a standardized tool. First published in print by the Netherlands’ Royal Academy of Arts and Sciences between 1973 and 1985, it is based on a hierarchical system of codes referring to themes, persons, objects, ideas, and events depicted in images. On the one hand, the use of Iconclass facilitates easy comparison between image data contained in the database. On the other hand, it also permits usage of the database independently of language and enables integration with other scientific databases or meta-databases. The Iconclass taxonomy is used to describe individual continent allegories and their elements as well as the entire iconographic context in which the specific depictions are situated. Thus we distinguished between two levels of implementation: Iconclass Context and Iconclass. The former refers to the iconography of the overall interior program of which the continent allegories are part. Only the main themes, such as “The Last Supper” or the “Baptism of Christ,” of the pictorial program accompanying the picture with the four continents are coded. The latter Iconclass goes into much more detail, as it focuses on the image with the four continents. Usually it is a single picture as seen in Tapfheim, but it can also be a group of images connected, as in the Augustinian canon’s church St Martin of Beuron. The iconography of the continent allegories is captured in much greater detail. Individual attributes, gestures and topics are recorded. This allows the user seeking all continent allegories that feature a crocodile (code 25F43) to bundle by mouse click. Our team member Christine Engelke, responsible for the implementation, applied 1,400 Iconclass codes a total of 13,400 times within the database.
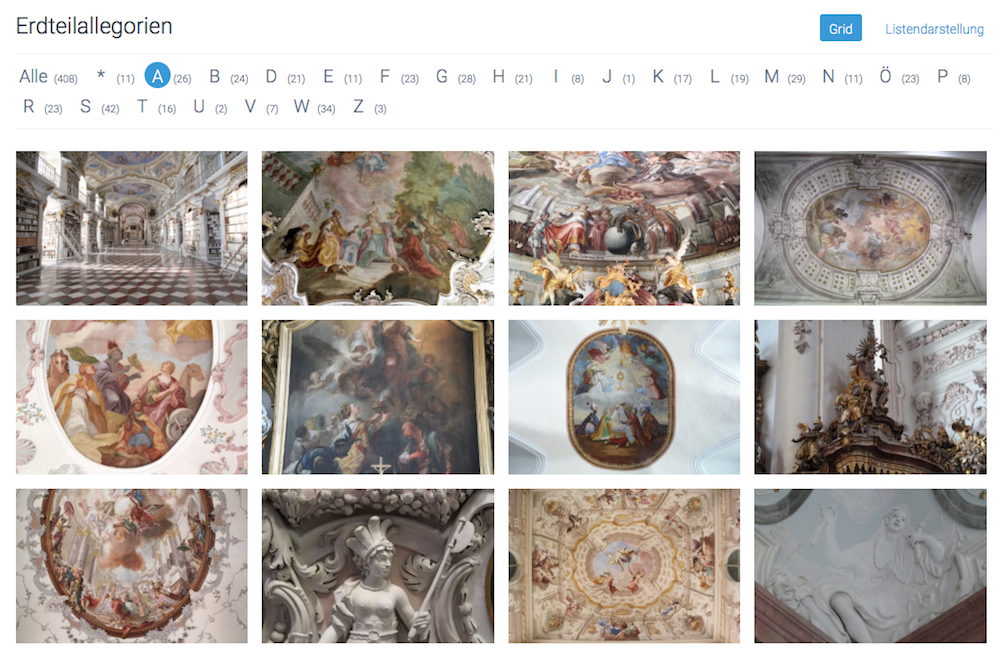
Fig. 11. Grid interface. Screenshot taken by Marion Romberg, 2017. Erdteilallegorien.
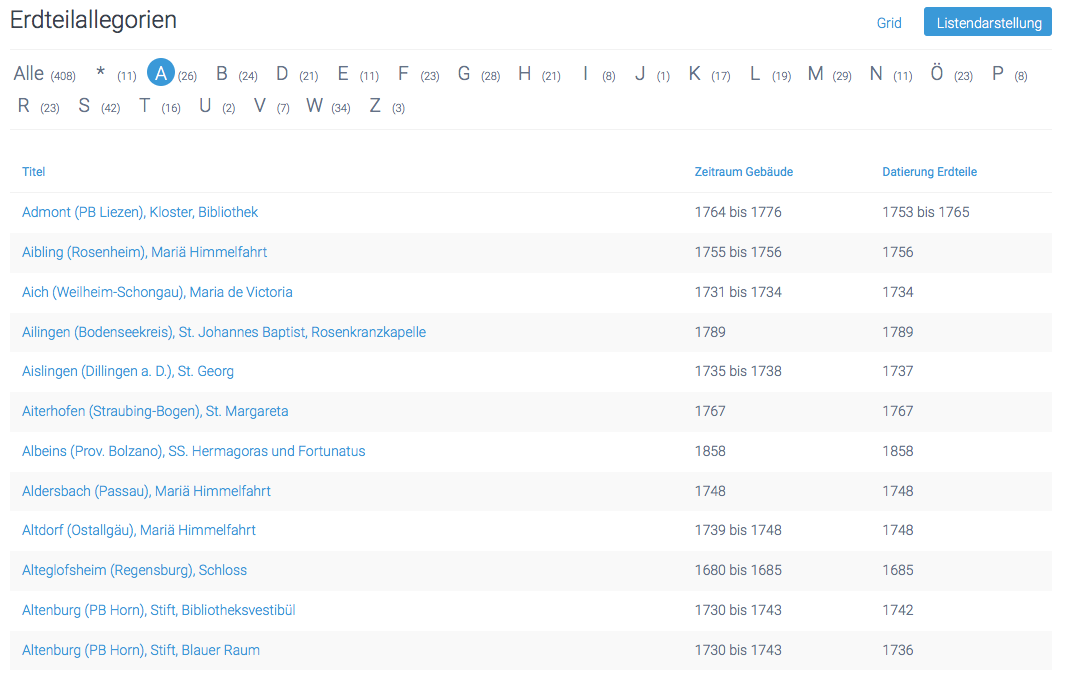
Fig. 12. List interface. Screenshot taken by Marion Romberg, 2017. Erdteilallegorien.
The search interface—SUCHE—allows the user to execute full text searches, which can be specified and filtered as desired. The specifications are predefined by the taxonomies included in the three categories, such as the positioning of the artwork in the room, the type of building, or the historical diocese. Search results are listed by relevance and can be shown on the map as well. Thus the search interface opens the possibility to search according to different interests and to compare the occurrence or prevalence of specific attributes. This will be demonstrated using the example of the tempietto, which Europe holds in her right hand (Fig. 1a). A full text search reveals twelve such instances of tempietto within the database and shows an accumulation in Southern Germany (Fig. 13).
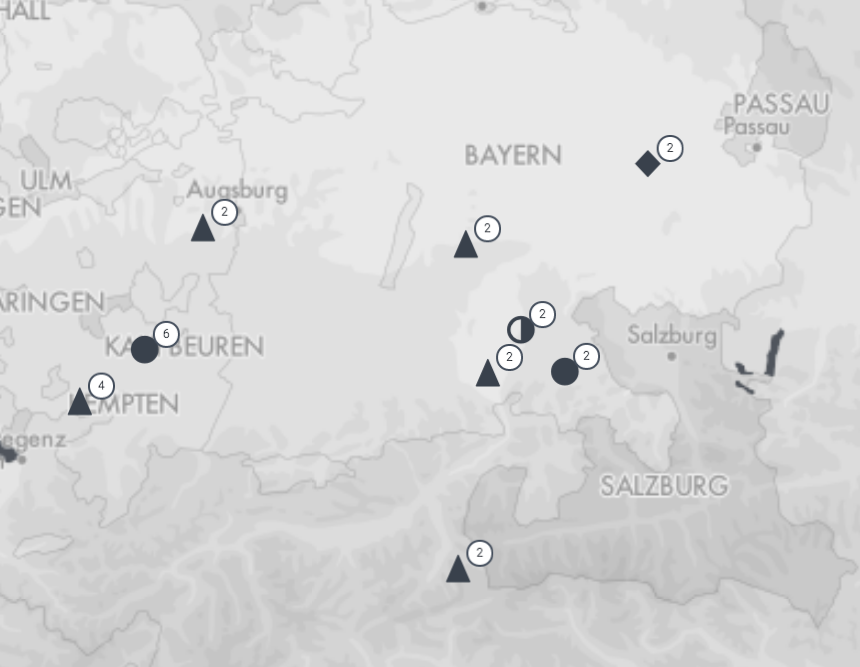
Fig. 13. Display of the search results on the map interface. Screenshot taken by Marion Romberg, 2017. Erdteilallegorien.
Central to the database are the digital images of the continent allegories and their visual and architectural context. In all, the database contains more than 6,000 jpg files selected from over 100,000 photographs taken at the sites. Although we only used photos taken by the team, we needed the permission of each property owner. In the written contracts we drew up it was necessary to prohibit download of the images in order to obtain permission to present the images in high resolution and in perpetuity in the database.
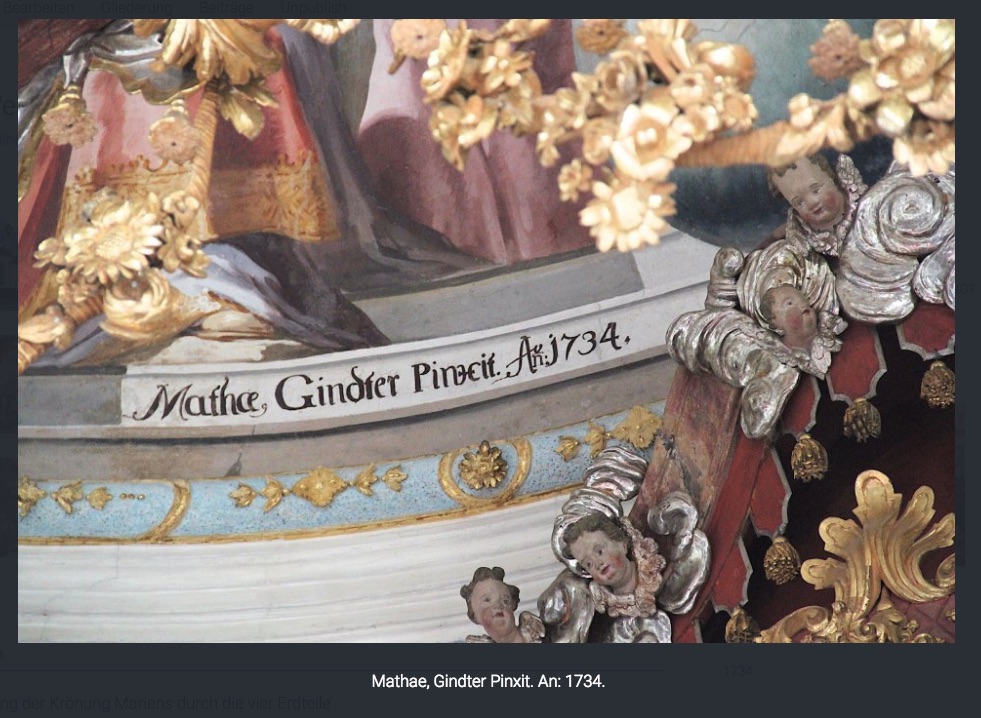
Fig. 14. Matthäus Günther, Adoration of the Coronation of Mary by the Four Continents (detail), 1734. Choir fresco, Church Maria de Victoria, Aich. Photo: Marion Romberg, 2011.
Each entry in the continent allegory category has a gallery of images attached, including detailed close-up shots as well as panoramic views of interiors and exteriors of the locations. These images are always arranged in a standardized sequence so as to facilitate orientation. Artist signatures, if present, are shown separately in close-up shots (Fig. 14). By browsing through such a gallery, users are provided with a comprehensive idea of a location as well as the significance and function of the continent allegories within that particular context. Annotations within the images explain motifs and link panoramic shots to close-up images or to photographs of other paintings, drawings or prints used as models (Fig. 15).
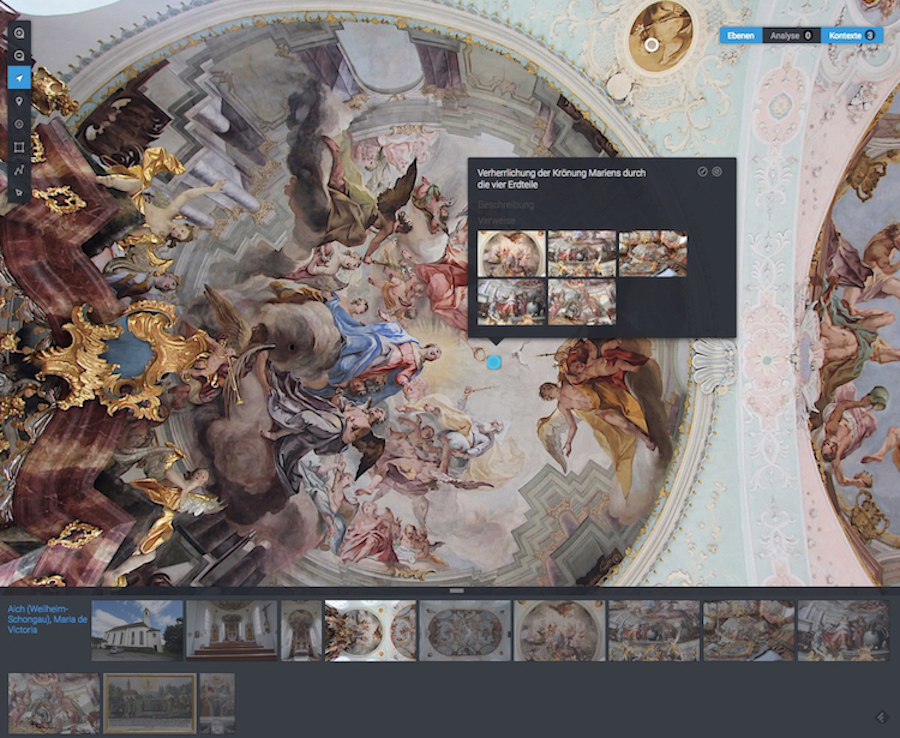
Fig. 15. View of photo annotation, Church Maria de Victoria, Aich. Screenshot taken by Marion Romberg, 2017. Erdteilallegorien.
Laying New Ground
This database has laid new art historical groundwork by using iconography as the basis for the project, rather than organizing along the lines of artist, geography, time period, or medium.[3] By doing so, researchers are given the opportunity to see a corpus of artworks that have never been brought together in the same interface or publication, but share obvious correspondences and connections. Moreover, this project represents the successful collaboration between historians of art and historians, both of whom share an interest in this subject matter but have often treated it with differing methodologies and approaches. Historians have examined the continent allegory and similar iconography in print publications with an interest in their social historical and discursive meaning.[4] By contrast, art historians have focused on images in situ with a concern for artistic practice, iconography, and authorship. By bringing together a team of historians and art historians, the varying interests and concerns of the two groups have merged and the tools provided by our interface allow for both groups to engage with the project according to their own research questions, while also gaining exposure to new ones from outside of their own discipline.
Looking back to the beginning of the project in 2012, our objective was not merely to create a big data pool, but an interactive database with various means to access the data (maps, timeline, grids). At the time, that approach was innovative and is still state of the art, particularly because the objects were geo-located. A comparable current project at the University of Munich, Dynastie im Raum. Die Grabstätten der Habsburger, focuses on the tombs of the Habsburg family, which—in contrast to places of birth and death—can be geo-located and thus are particularly suitable for presentation on a digital map. Another relevant example is ongoing at the Salzburg University on the topic of music printing in German-speaking lands (1470-1550).
Moreover the discussion[5] on how to utilize the full potential of the digital, in a project like ours, is well underway with the following creative possibilities:
1. User Accounts: In order to further promote individual research, user accounts are of great importance, although our project had to dismiss this option due to our time limitations. A best practice example is the private online collections made available by the Rijksstudio, the digital collection of the Rijksmuseum, Amsterdam, which not only allows users to save entire artworks, but also to select details of an image and thus create their own narration. In our database we were only able to present a few sample narrations for some examples, for instance on the theme, Zwischen Vertraut und Barbarisch. Die Präsenz des Fremden im Dorf (Between familiar and barbaric. The presence of the other in the village).
2. Public collaboration: Crowdsourcing is a useful way to overcome restraints on time and resources, as demonstrated by the project ARTigo, based at the Diathek of the Institute for Art History at the University of Munich. The project allocates keywords to each artwork, thus making the work accessible to computerized searches. However, this was very time consuming and labor intensive, so the project team created a game, in which the user spontaneously tags the images that he or she is shown, thus aiding in this effort. In addition to entertainment, the user is offered “training as you get to know quite a lot about the paintings shown here”[6] and the opportunity to contribute to research through a leisure activity.
3. Picture recognition: The cultural institute of Google Arts & Culture has developed an algorithm, which allows new cross-connections between two seemingly disconnected images to be revealed. This platform is already used by more than 1.200 partners in 70 countries.[7]
Over the next two years, several projects whose circumstances and source corpus are similar to ours will go online. These research projects will set further standards for continuing digital work in art history:
1. The database “Scientific infrastructure for art-historical monuments in East Central Europe” at the Herder-Institut für Ostmitteleuropaforschung of the Leibniz Association will go online in 2018. It is also based around a diverse and difficult to access corpus of buildings that have not been fully studied.
2. The database of the “Corpus der barocken Deckenmalerei” plans its launch in 2019. The project, undertaken by the Bavarian Academy of Sciences (Munich), experimented in a pilot project with a 3D space model of the emperor’s room in the residence of the bishop of Bamberg.[8] Over the next 25 years, it aims to record all mural paintings in the Federal Republic of Germany in a database. The project uses the virtual research environment WissKI, the German acronym for “Wissenschaftliche KommunikationsInfrastruktur/Scientific Communication Infrastructure.”
These projects will hopefully break new ground and promote ongoing research along lines that the original project team may not have envisioned at the outset.
Further results of our research project can be found in the published anthology The Language of Continent Allegories in Baroque Central Europe, ed. Wolfgang Schmale, Marion Romberg, and Josef Köstlbauer (Stuttgart: Franz Steiner Verlag, 2016) and in the doctoral thesis by Marion Romberg, published as Die Welt im Dienst des Glaubens. Erdteilallegorien in Dorfkirchen auf dem Gebiet des Fürstbistums Augsburg im 18. Jahrhundert (Stuttgart: Franz Steiner Verlag, 2017).
Marion Romberg is affiliated with the Austrian Academy of Sciences, Institute for Modern and Contemporary Historical Research, Vienna
[1] Cesare Ripa included the personification of the continents for the first time in the second edition of his reference book, Iconologia overo descrittione di diverse imagini cavate dall’antichita e di propria inventione dichiarate; di nuovo revista (Rome, 1603).
[2] Only those examples that remained in their original locations were included.
[3] For examples of ongoing projects that contribute to an understanding of the development of Baroque mural paintings, see, in regard to Germany, “Corpus der barocken Deckenmalerei” (University of Munich, Department of art history); in the Czech Republic, “Ceiling Painting in the context of monastic architecture in Czech lands” (Prague, Academy of Science, Department of art history); in Hungary, “Development of a database and iconographical index for baroque frescos” (Budapest, Pázmány Péter Catholic University, Department of art history). The missing link between the two latter examples is a systematic survey of Austrian mural paintings in the Baroque Era, which would provide a complete understanding of the cultural transfer process within the Habsburg monarchy. Also desirable would be the definition of common standards for digital dissemination.
[4] For a summary, see Marion Romberg, Die Welt im Dienst des Glaubens. Erdteilallegorien in Dorfkirchen auf dem Gebiet des Fürstbistums Augsburg im 18. Jahrhundert (Stuttgart: Franz Steiner Verlag, 2017), 83-88.
[5] Various opportunities have been discussed, for instance in the following conferences: “(Art-)history goes digital. Reichweite und Grenzen digitaler Methoden in der historischen Forschung,” held at the Bavarian Academy of Sciences in Munich on July 1, 2017 (https://cast.itunes.uni-muenchen.de/vod/playlists/pD3rreOSbW.html); “Hispanic Digital Humanities,” Malaga, Spain, October 18-20, 2017.
[6] For more information about ARTigo: https://www.artigo.org/about.html.
[7]Andrian Kreye, “Alle sollen so zur Kunst kommen,” Süddeutsche Zeitung, February 18, 2017: http://www.sueddeutsche.de/kultur/kultur-und-technik-alle-wirklich-alle-sollen-so-zur-kunst-kommen-1.3383508
[8] Jürgen Moises, “Wissenschaftliches Projekt. Per Joystick durch barocke Welten,” Süddeutsche Zeitung, January 2, 2017: http://www.sueddeutsche.de/kultur/wissenschaftliches-projekt-per-joystick-durch-barocke-welten-1.3318191
Contact Information – Project Team (2012-2016)
Prof. Dr. Wolfgang Schmale, University of Vienna: www.wolfgangschmale.eu
Dr. Marion Romberg, Austrian Academy of Sciences (Vienna): www.marionromberg.eu
Dr. Josef Köstlbauer, University of Bremen: josef.koestlbauer@univie.ac.at
Cite this note as: Marion Romberg, “Continent Allegories in the Baroque Age – A Database,” Journal18, Issue 5 Coordinates (Spring 2018), https://www.journal18.org/2412. DOI: 10.30610/5.2018.6
Licence: CC BY-NC
Journal18 is published under a Creative Commons CC BY-NC International 4.0 license. Use of any content published in Journal18 must be for non-commercial purposes and appropriate credit must be given to the author of the content. Details for appropriate citation appear above.