
James Tice
The 1748 Pianta Grande of Rome (Fig. 1) by Giambattista Nolli (1701-1756) is a milestone in the history of cartography. Its copious size (1760 x 2085 mm), intricate detail, and accuracy have made it an essential document for studying the architecture, landscape architecture and urban structure of Rome for over 250 years. The Nolli Map has served as the basis for a series of interactive digital projects that present historic maps and images of Rome as key resources for understanding the spatial history of that city.[1] The first of these projects, The Interactive Nolli Map Website, which digitally remasters this classic as an interactive tool, making it widely available to students, scholars and the general public, was launched in 2005. The next stage of the project involved the vedute, or urban landscape views, of Rome from Delle Magnificenze di Roma Antica and Moderna by Nolli’s contemporary and collaborator, Giuseppe Vasi (1710-1782). These 237 images were geo-referenced to the cartography of Nolli and linked to modern views, resulting in Imago Urbis, Giuseppe Vasi’s Grand Tour of Rome, which was published in 2008. Our current ongoing project, Open Rome: A Spatial History, digitally derived from the Nolli map and other cartographic sources, develops a layered cartographic system that extends from antiquity to the present. This array of historic and contemporary maps of Rome, provisionally displayed at Mapping Rome, is geo-rectified and brought into real geographic space, providing a scientific dimension for further research and discovery—especially for ongoing archeological studies of the Eternal City. Central to this investigation is the Forma Urbis Romae by Rodolfo Lanciani (1845-1929). This huge map consists of 46 plates with an overall dimension of 4560 x 6960 mm and is inspired by the early third-century marble map, Forma Urbis, from which it takes its name. It is significant that Nolli based his plan view or ichnographic mode on the precedent of the Forma Urbis.
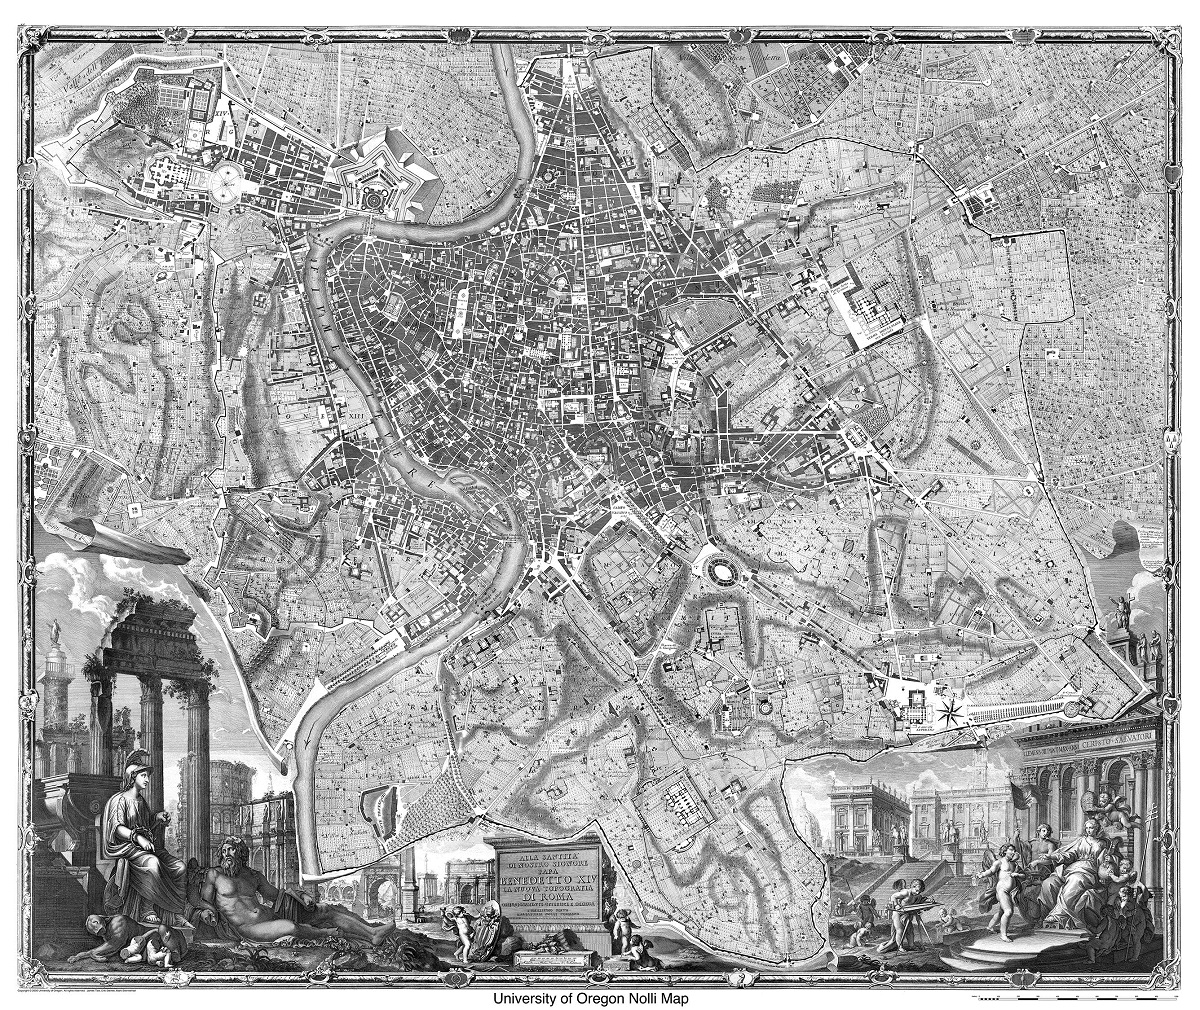
Fig. 1. Giambattista Nolli, Pianta Grande, 1748. Digitally remastered, 2005, from original print engraving, 1760 x 2085 mm. Courtesy John Reynolds. Digital Copyright University of Oregon, 2005. Digitization by James Tice, Erik Steiner, Mark Brenneman.
Our goal is to remaster, update and geo-rectify Lanciani’s map, thereby extending the promise of the Nolli map as a digital geo-database with an encyclopedic array of linked topographic and textual information—all referenced within an open and accessible GIS framework.
The Nolli map is extremely useful for the embedded information that it contains for eighteenth-century Rome. Beyond the cartographic depictions of churches, palaces, streets, walls, bridges, gates, villas, vineyards, gardens and so forth, it also provides 1,320 numbered places which are cross referenced to indices on separate plates that list these features topographically by rione (city district) and also alphabetically by type. In addition, there are over 500 place names in script carefully integrated on the map indicating city districts and landscape sites that span larger terrains such as the Villas Cesi and Barberini—graphic space permitting. The textual information, numerically referenced and embedded on the map, can help determine city precincts devoted to crafts, national centers and rioni.
But it is another important aspect of the Pianta Grande that has been the focus of our work for the last several years, an aspect suggested by Nolli but unfulfilled. That is a careful look and scientific description of ancient Rome, a city that could emerge unexpectedly from under the foundations of the eighteenth-century city or appear as isolated ruins in the disabitato (uninhabited districts, yet proximate enough to fall within the ancient Aurelian wall circuit). Because of Nolli’s brilliance as a surveyor, his extraordinary map with its unequalled accuracy, detail and comprehensive treatment of the city became the base for virtually all plan view maps for over two hundred years. As we shall see, it is an analogous base map to our own GIS project, serving as a useful means to geo-reference a great variety of data, some of which veered off in ways hardly imagined by Nolli himself. Thus, the digital collating and reconciling of these maps with a plenitude of information is an organic development in a historic process that has been taking shape for centuries, albeit with new technologies.
Nolli was keenly aware that the “modern city” he depicted was built on the ancient city beneath his very feet. He could, for example, in the classically inspired entourage at the left-hand base of his map, illustrate this information with an eloquence rarely matched by contemporaries, with the important exception of his some-time collaborator, Giovanni Battista Piranesi (1720-1778). From a cartographic point of view, the information concerning ancient Rome in his map proper is perhaps less evocative than the pictorial illustrations but more revealing in terms of its topographic significance. There are 104 ancient monuments and place names noted on the map as recorded in his alphabetical legend “Antichità che’Esistono.” The method he used to depict ancient monuments is important, as we shall discover, as it served as a model for modern archeologists. Simply, when foundation walls of ancient monuments such as the Coliseum could be verified they were shown in black; when foundation walls were not verifiable but could be interpolated (as logically continuing an arc of columns or piers for curved seating) the walls were shown in outline only, with no pochè or infill.
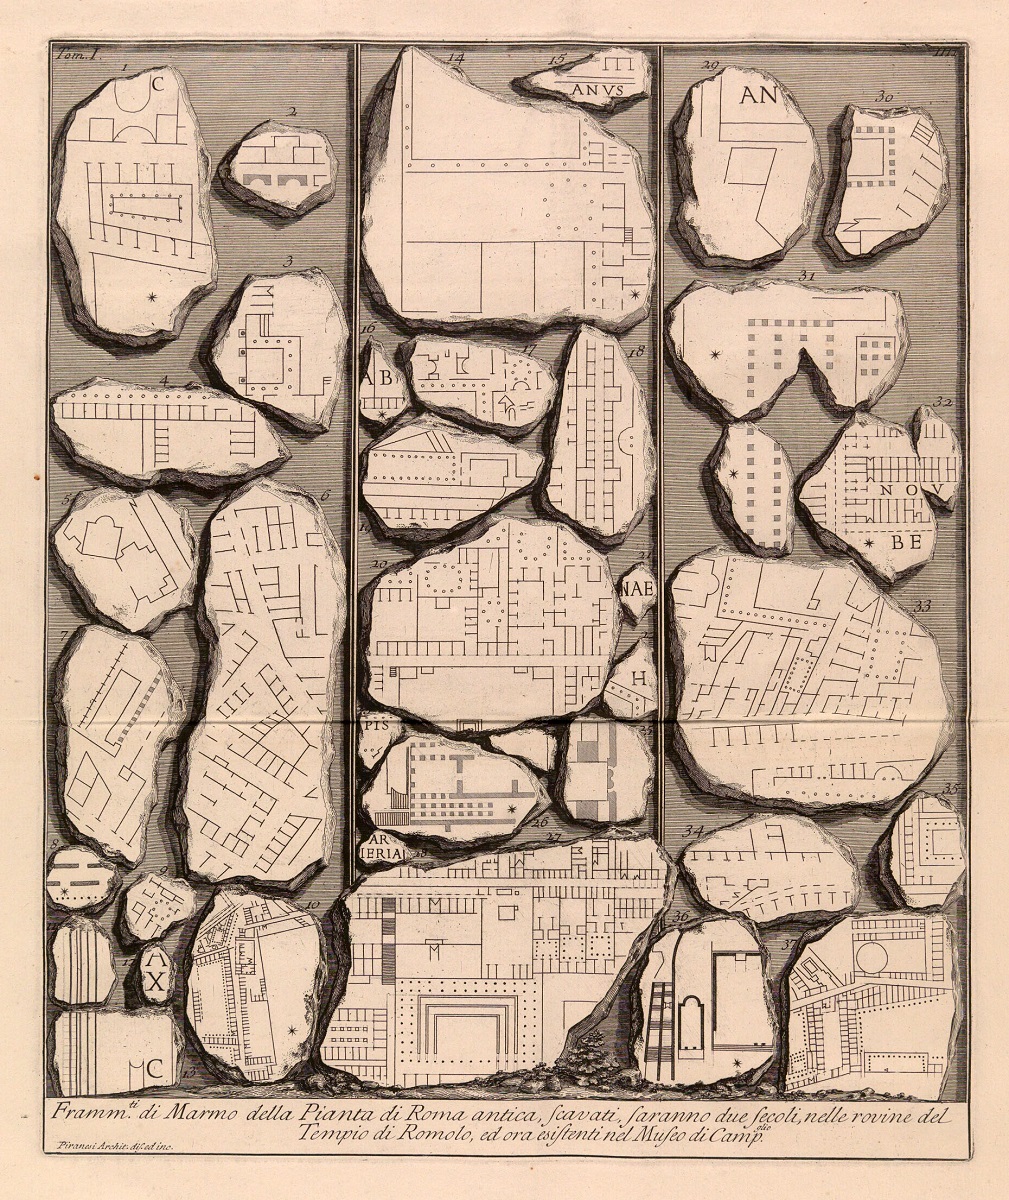
Fig. 2. Giovanni Battista Piranesi, Fragments of the Forma Urbis, Le Antichità Romane, 1756, engraving on paper, 460 x 380 mm. Courtesy Ghent University Library.
As Allan Ceen has pointed out, unlike Piranesi, Nolli was not an accomplished antiquarian; he was more interested in the modern city of his day.[2] By contrast, Piranesi’s contribution to the study of ancient Rome and its monuments was more carefully researched. But his reliance on Nolli’s cartography gives a spatial dimension and topographic accuracy to his work that would not otherwise exist. After Nolli exhibited the extant fragments of the ancient marble map of Rome, the Forma Urbis, in the Palazzo Nuovo courtyard on the Campidoglio, Piranesi carefully rendered the marble pieces in his four-volume set Le Antichità Romane of 1756 (Fig. 2). It is Piranesi’s prints which make palpable the direct link to Nolli’s work in an archeological vein since both studied the fragments of that marble map, but it was Piranesi whose attention to archeological accuracy outstripped Nolli’s.
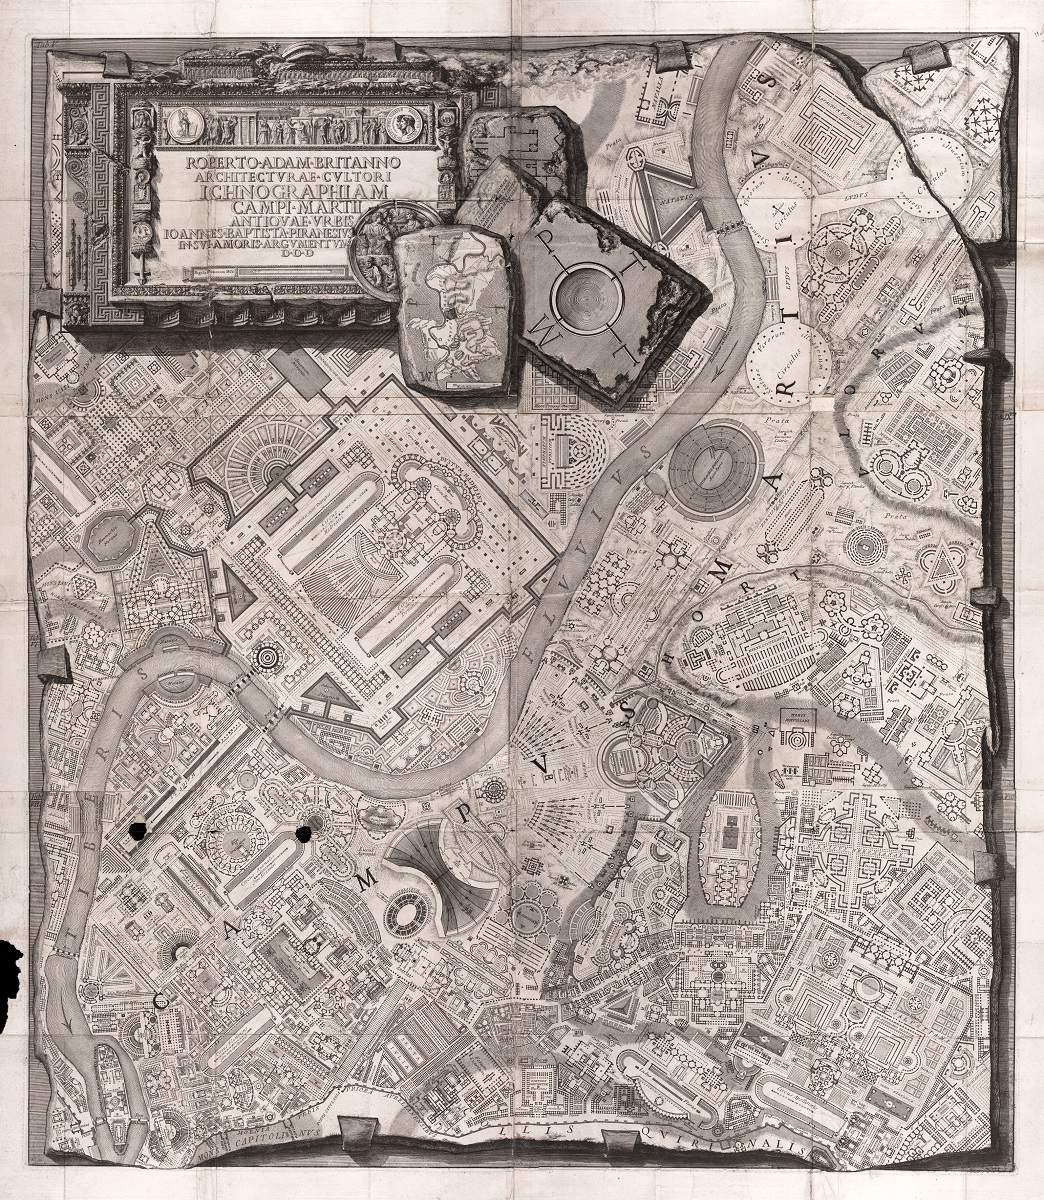
Fig. 3. Giovanni Battista Piranesi, “Ichnographia” or Imaginary Plan of the Campus Martius, 1762, engraving on paper, 1350 x 1170 mm. Courtesy Ghent University Library
Except for the 1551 Leonardo Bufalini map (also reintroduced and carefully modified by Nolli in 1748) and Antonio Barbey’s smaller 1697 map, Nuova Pianta della Città di Roma, Nolli’s Pianta Grande is the first comprehensive and accurate map of Rome to use the ichnographic method since antiquity. From this point onward, it became the indispensable foundation upon which countless cartographers relied to ensure that they too could provide an accurate and detailed plan of Rome. Piranesi, Nolli’s immediate successor to this legacy, relied upon Nolli’s surveying expertise on several important occasions.[3] Even though Piranesi’s most famous plan of Rome is his fantastic Ichnographic Plan of the Campus Martius (1350 x 1170 mm) from 1762 (Fig. 3), where he depicts a vast cityscape of invented “ancient monuments” to populate an otherwise accurate base map of the city literally derived from Nolli, he could also use the same maps for strictly antiquarian purposes. In fact, he layered or “geo-located” an exhaustive body of surprisingly accurate archeological information, faithfully reproducing Nolli’s map as a base. It is interesting to reflect that it was Piranesi who collaborated with Nolli and provided the illusionistic entourage for another one of Nolli’s maps, Piccola Pianta (470 x 688 mm), a smaller version published along with the Pianta Grande in 1748. Piranesi simply traced this smaller map on several occasions to expand his archeological research that was only hinted at or unknown by Nolli. One such example of this “retrofit” is Piranesi’s ancient map of Rome, Pianta di Roma of 1756 (Fig. 4) from Le Antichità Romane (460 x 680 mm), which duplicates at the same scale the Piccola Pianta. In this case, Piranesi diverges from Nolli, however, as the contemporary city is erased within the Aurelian Walls and populated with hundreds of ancient numbered entries referring to the fragments of the Forma Urbis crowding along the edges of the map. A second map of ancient Rome by Piranesi from 1774, entitled Pianta di Roma e del Campo Marzo (940 x 705 mm), once again deploys Nolli’s base plan drawn from the smaller map, including 402 entries, all of which are antique. Strangely he inverts the map so that north is at the bottom of the print and extends well beyond the zone of the Campus Martius to the Ponte Milvio, several kilometers to the north of the Porta del Popolo.
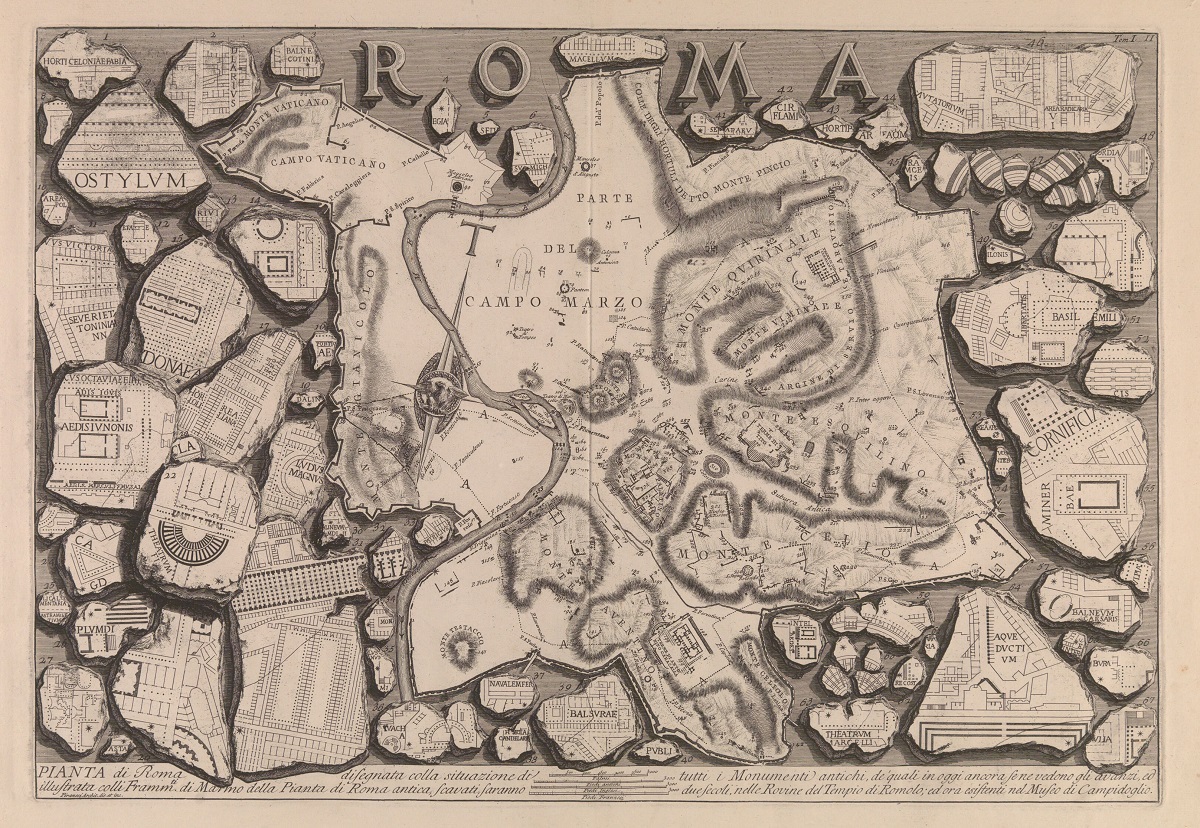
Fig. 4. Giovanni Battista Piranesi, Pianta di Roma Antichità with surrounding fragments of the Forma Urbis, 1756, engraving on paper, 465 x 680 mm. Courtesy Ghent University Library
Piranesi’s reliance on these maps proved the utility of Nolli’s superior surveying expertise. This precedent appears to have inspired the work of the archeologist Luigi Canina (1795-1856), who in 1850 published his Pianta Togografica di Roma Antica (954 x 696 mm) at 1:1000[4] almost exactly one hundred years after the publication of the Pianta Grande. Following Piranesi’s lead, Canina’s map shows the city surrounded by the same marble fragments of the Forma Urbis (Fig. 5). Canina’s important innovations, however, become apparent with more detailed inspection (Fig. 6). First of all, he placed drawings of the fragments along its perimeter and matched them with identical fragments in situ within the map proper, giving each spatial significance. Secondly, he conceived the map as a stratified geo-database, whereby ancient monuments were graphically superimposed on the modern map of Rome, derived from Nolli, as a semi-transparent layer. He further distinguishes the actual fragments in a gray tone, with a not entirely successful attempt at completing the fragments with his own hand and “fervid” imagination—the last quotation taken from an address[5] by our next cartographer of note.
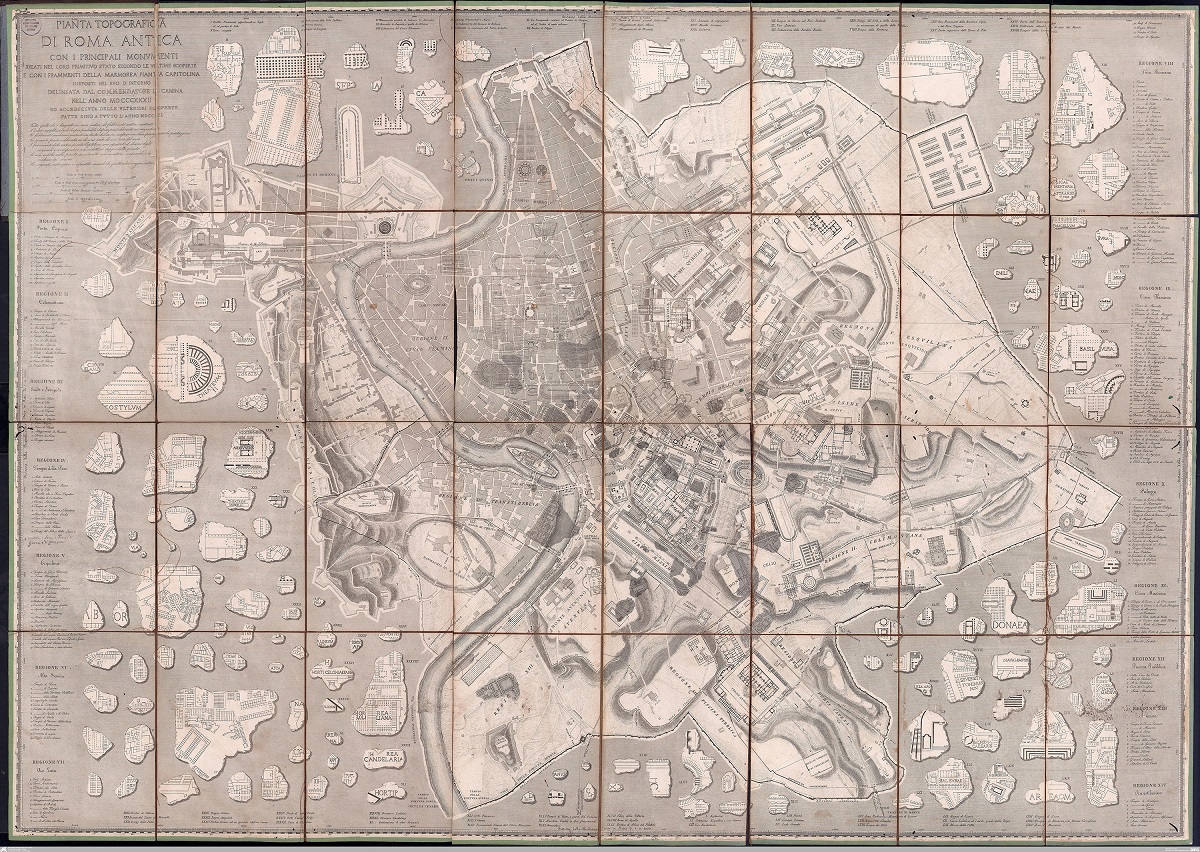
Fig. 5. Luigi Canina, Pianta Topografica di Roma Antica, showing fragments of the Forma Urbis superimposed on the author’s version of G.B. Nolli’s Pianta Grande, 1850, lithograph 954 x 696 mm at 1:1000 scale. Courtesy iDAI.Images/Arachne
This layered technique, using the Nolli map as reference base, was adopted fifty years later in 1901 by Rodolfo Lanciani in his magisterial map of Rome, which he christened, significantly, Forma Urbis Romae. It is possible to draw the lineage of Lanciani’s map, our current focus, from Nolli to Piranesi and then to Canina.
Fig. 6. Luigi Canina, Pianta Topografica di Roma Antica, detail of the Campo Marzio, 1850, lithograph. Courtesy iDAI.Images/Arachne
Lanciani devoted his professional life to the documentation of Rome from antiquity to the modern era. He was the major figure in Roman archeology of his generation. His career spanned the years from 1870, when Rome became the burgeoning capital of unified Italy, to the 1920s, when Mussolini began wrecking vast swaths of the city’s historic core. Lanciani witnessed the drastic transformation (and destruction) of Rome firsthand. No doubt, it must have compelled him to record Rome’s historic legacy and to collect thousands of original drawings, prints and photographs of the city to preserve this legacy—if only on paper. His exhaustive record of the city divides into four important and interlinked areas: 1) his vast archive of 15,000 images that includes drawings, prints and photographs now housed at the Fondo Lanciani, 4,000 objects of which can be viewed on our most recent website, Images of Rome: The Rodolfo Lanciani Digital Archive; 2) his Storia degli Scavi, a seven-volume record (two of these volumes were published posthumously) that recounts the history of the excavations of the city from the eleventh to the early twentieth century; 3) his extensive books on Rome, most of which, curiously, were published first in English and only later in Italian; and lastly 4) his extraordinary cartographic achievement, the Forma Urbis Romae (Fig. 7). By incorporating all the information above into the map through a variety of notational techniques, the map can represent Lanciani’s extensive knowledge distilled onto a synoptic encyclopedic medium. This cartographic compendium has been the subject of our continuing research and serves as a means to draw together all the key maps cited in the discussion above.
Fig. 7. Rodolfo Lanciani Forma Urbis Romae, 1901. Lithograph on paper (46 plates bound as single volume) assembled size 4560 x 6960 mm at 1:1000 scale. Collection: Studium Urbis, Rome.
Although begun in 1870, the Forma Urbis Romae was printed later in serial installments over a ten-year period leading up to its definitive publication in 1901. The map is rendered at the scale of 1:1000, thus repeating the scale established by Canina and underscoring the importance of readily available cadastral maps that were based on Nolli. The Forma Urbis Romae reveals more comprehensive and detailed information about the topography and built fabric of Rome than any previous map of its kind. Following on Canina’s lead, the Forma Urbis Romae is layered according to historical epochs. But Lanciani introduced color-coded layers to “delaminate” the map and facilitate viewing. Republican Rome is rendered in a dark ox blood, Imperial and medieval Rome are rendered in black, Renaissance and Baroque Rome in red and Roma Capitale, the city after 1870 as it was known to Lanciani, is rendered in blue. The resultant color-coded stratigraphy allows the observer to see the evolution of Rome over time, simultaneously. It is worth noting that Lanciani integrated the fragments of the ancient marble plan—limited as they were at that time—directly into his map by placing them into their correct spatial location within the antique “black” layer (rather than merely surrounding the map’s perimeter as had been the case for Piranesi). Over a century after its original publication, the Forma Urbis Romae remains the standard archeological reference for Roman topography, even though it does not incorporate the host of archeological discoveries that have come to light since its creation.
Ongoing Work
Fig. 8. Detail of the Campus Martius, digital image based on S.A.R.A. Nistri, Photogrammetric Plan of Rome, ca. 1968. Image created using ArcGIS, Adobe Photoshop by Dennis Beyer, Lauren Hoffman, David Cho and others using Adobe Illustrator, 2010.
Open Rome is a digital platform for our ongoing project. This project is based on Lanciani’s original, which has been completely vectorized (digitally re-mastered line by line as shape files) over a five-year period. It is in the process of being geo-rectified (rubber sheeted and brought into real geographic space) using state-of-the-art software, ArcGIS, and the exacting photogrammetry of the S.A.R.A. Nistri survey maps (Fig. 8), which provide a precise scientific baseline using the Italian coordinate system Monte Mario Italy 2. Additionally, contemporary satellite imaging has been used to correct, verify and otherwise refine our updated Lanciani map along with S.A.R.A Nistri, Nolli, and finally Lanciani’s Forma Urbis Romae (Fig. 9). Our digitally remastered map, Open Rome Forma Urbis, now makes it possible to visualize every building, street, ancient monument and textual annotation recorded by Lanciani. We are working toward the ambitious goal of amending and updating a significant portion of that work using contemporary archeological sources and research conducted by our own team and amplified by scholars such as Lothar Haselberger, Margareta Steinby and Filippo Coarelli.
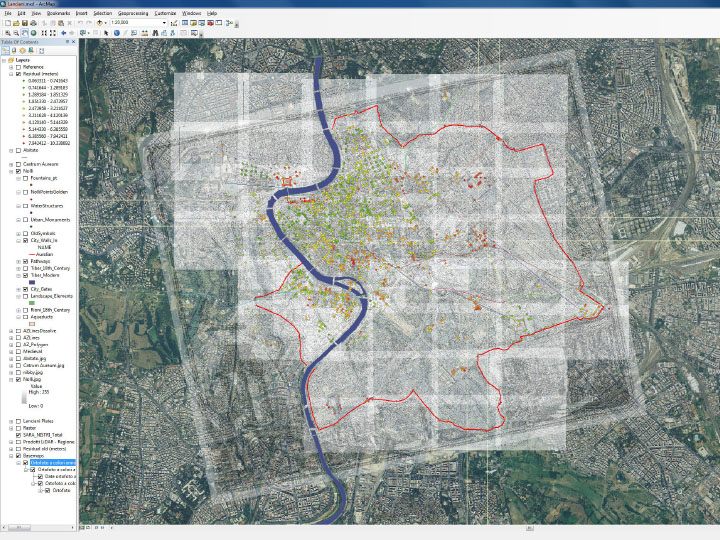
Fig. 9. ArcGIS composite overlay and geo-rectification of Rome: Nolli Map, S.A.R.A. Nistri Map, Bing Satellite Map and Open Rome Forma Urbis, 2012. Image creation by Giovanni Svevo, Erik Steiner and James Tice, using ArcGIS, 2012.
With Open Rome all of the many hundred layers can be viewed at once, or selectively made visible or invisible to create countless unique cartographic combinations (Figs. 10 and 11). From a temporal point of view, for example, it is possible to reveal all the structures that existed during the reign of Augustus. From a typological perspective, it is possible to visualize all the water elements in the city as one image: the Tiber and its tributaries, aqueducts, fountains, cisterns, and wells. It is also possible to combine temporal and typological information so that one can view, for instance, all the churches constructed during the twelfth century, and, narrowing down this data set even more, focus on those which contain materials (spoglia) repurposed from ancient monuments. This stratigraphy provides a rich and complex palimpsest that allows the viewer to observe the vicissitudes of Rome as it has evolved over three thousand years.
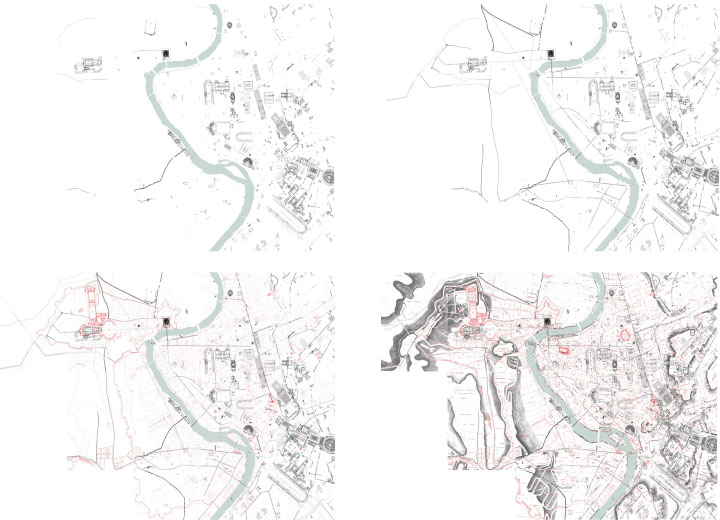
Fig. 10. Portion of Open Rome Forma Urbis, 2012, along the Tiber. Image created by Kelly Mabry, Dennis Beyer, Lauren Hoffman and James Tice. Image created using ArcGIS, Adobe Photoshop and Adobe Illustrator, 2010.
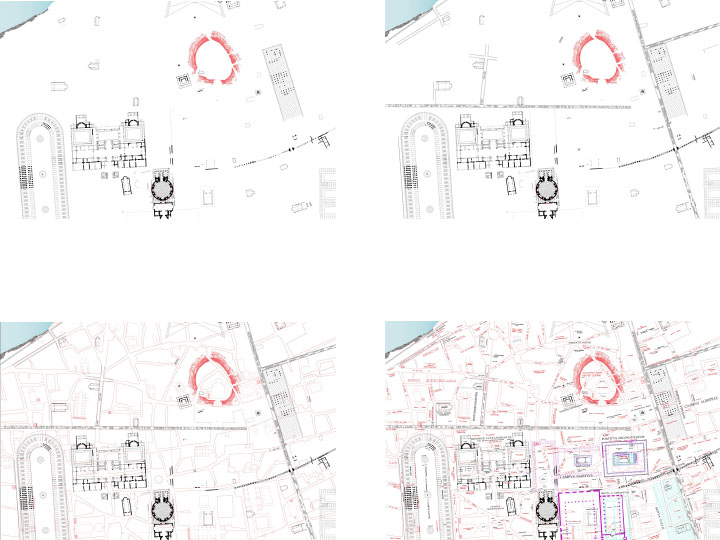
Fig. 11. Detail of Plate 15, Open Rome Forma Urbis, 2012, showing delaminated layers along with corrections and select updates. Image created by Kelly Mabry, Dennis Beyer, Lauren Hoffman and James Tice. Image created using ArcGIS, Adobe Photoshop and Adobe Illustrator, 2010.
The 1748 Pianta Grande by Giambattista Nolli is the genesis of a long tradition which has informed a series of outstanding cartographic works by Giovanni Battista Piranesi, Luigi Canina and finally Rodolfo Lanciani. The promise of Nolli’s map as a geo-database, and its scientific potential to spatially locate and accurately depict the architecture and urbanism of Rome, has now been extended and enhanced through the use of modern GIS technology and innovative visualization techniques (Fig. 12). Our ongoing work, Open Rome, is intended to serve as an openly accessible and robust geo-database that collects this body of work for the use of scholars, students and the general public.
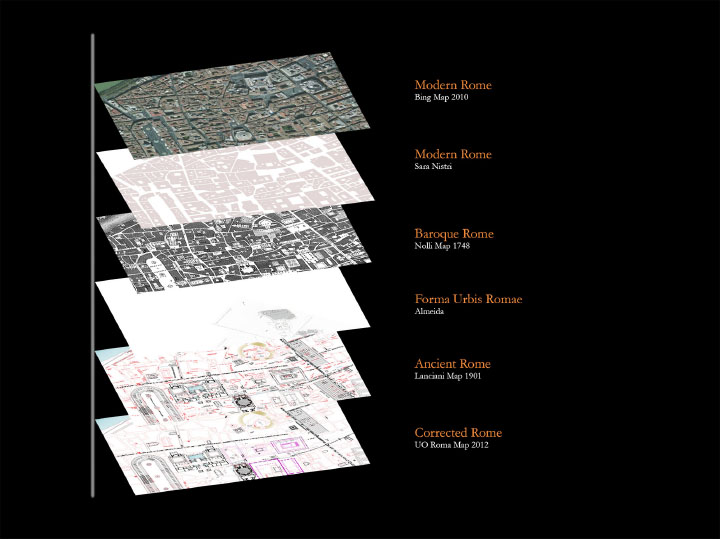
Fig. 12. “Layers of Rome” in descending order: Modern Rome (Bing), Modern Rome (S.A.R.A. Nistri), Baroque Rome (Nolli), Ancient Rome (Forma Urbis according to Almeida), Ancient Rome (Forma Urbis Romae according to Lanciani), Ancient Rome (Open Rome: Forma Urbis, 2012). Image created by James Tice using Adobe Photoshop, 2012.
James Tice is a registered architect and Professor of Architecture at the University of Oregon
[1] This essay reflects the ongoing research project, “Open Rome,” and is the result of a collaboration between the University of Oregon, Stanford University, Studium Urbis and Dartmouth College. Principal Collaborators include:
Nicola Camerlenghi, Assistant Professor of Art History, Dartmouth College;
Allan Ceen, Director, Studium Urbis, Rome;
Erik Steiner, Co-Director, Spatial History Project and the Center for Spatial and Textual Analysis (CESTA) at, Stanford University;
Giovanni Svevo, National Director of the Associazione Nazionale Archeologi;
James Tice, Professor of Architecture, University of Oregon.
Primary Research assistants for this article have included: Dennis Beyer, Lucas Dube, Lauren Hoffman, Cody Leff, Kelly Mabry, Anna Ponting, and Ashleigh Wais. Funding during this period has been provided by the American Council of Learned Societies, the University of Oregon, the Samuel H. Kress Foundation and the Neukom Institute.
[2] See Allan Ceen, Roma Nolliana (Rome: Studium Urbis, 2003), which treats Piranesi’s coverage of the Theatre of Pompey.
[3] See Ceen, Roma Piranesiana: Piranesi’s Plans of Rome (Rome: Studium Urbis, 2015), which discusses Piranesi’s cartographic debt to Nolli.
[4] Canina’s map was based on the series of catasti urbani (cadastral or tax maps) which in turn were based on Nolli’s map. The tax maps were begun in 1821 and continued through 1871. They became the immediate basis for Lanciani’s Forma Urbis Romae which was also created at the same scale of 1:1000. Our evidence shows that Lanciani probably traced one or both sources.
[5] Giovanni Svevo called my attention to the following critical article where he lays out his ambitious program for the next 25 years: Rodolfo Amedeo Lanciani, “Intorno alla grande pianta di Roma antica,” in Atti della Reale Accademia Nazionale dei Lincei, s. 2, III [1875-76], 296-305.
Cite this note as: James Tice, “A Digital Extension of a Roman Cartographic Classic: The 1748 Nolli Map and its Legacy,” Journal18, Issue 5 Coordinates (Spring 2018), https://www.journal18.org/2493. DOI: 10.30610/5.2018.5
Licence: CC BY-NC
Journal18 is published under a Creative Commons CC BY-NC International 4.0 license. Use of any content published in Journal18 must be for non-commercial purposes and appropriate credit must be given to the author of the content. Details for appropriate citation appear above.